
AI agent observability is the ability to reconstruct what an AI agent did, why it did it, what resources it consumed and whether the final outcome was actually correct.
That requires more than application logs. A production agent may call several models, search a knowledge base, invoke external tools, update internal state, delegate work to another agent and request human approval before a single task is complete. A technically successful HTTP request tells you very little about whether that workflow behaved correctly.
A useful AI agent observability system should therefore expose six signals:
- Trace: What steps did the agent execute?
- Quality: Did the task produce the intended result?
- Tools: Which tools were called, with what arguments and outcomes?
- Cost: How much did the completed task consume?
- Performance: Where was time spent, especially at p95 and p99?
- Control: Were permissions, approvals and escalation rules followed?
The objective is not simply to collect more telemetry. It is to make every important production outcome explainable.
What Is AI Agent Observability?
Monitoring tells you that something happened. Observability helps you determine why.
Traditional monitoring might tell you that an endpoint took four seconds, returned HTTP 200 and consumed 8,000 tokens. Agent observability should let you open that run and see the sequence that produced the result.
Tracing records that execution path. Monitoring aggregates signals across many runs. Evals measure the quality of agent behavior or outcomes. Together, they provide the operational picture needed to run agents reliably in production.
OpenInference formalizes this idea using traces made up of spans representing operations such as LLM calls, agent steps, tool executions and retrieval operations. It builds these AI-specific semantics on top of OpenTelemetry.
Why Traditional APM Is Not Enough for AI Agents
Conventional application performance monitoring is excellent at questions such as:
- Did the request fail?
- Which service was slow?
- Which database call timed out?
- What exception occurred?
Agents introduce another category of failure: the infrastructure can work while the task fails.
A customer-support agent could successfully return a response after retrieving the wrong policy. An operations agent might call the correct API with incorrect arguments. An autonomous workflow could enter a reasoning loop, repeat the same tool call seven times and eventually return a valid-looking answer. Nothing necessarily crashes.
That is why agent monitoring needs to capture both system behavior and semantic behavior.
The distinction is increasingly visible in agent frameworks themselves. For example, OpenAI’s Agents SDK exposes separate tracing for model generations, function tools, guardrails, handoffs, agent executions and custom operations rather than treating the entire workflow as one API request.
The Anatomy of an Agent Trace
The trace should be the basic unit of production debugging.
One trace represents one logical agent run. Child spans represent the significant operations performed during that run.
An illustrative customer-support trace might look like this:
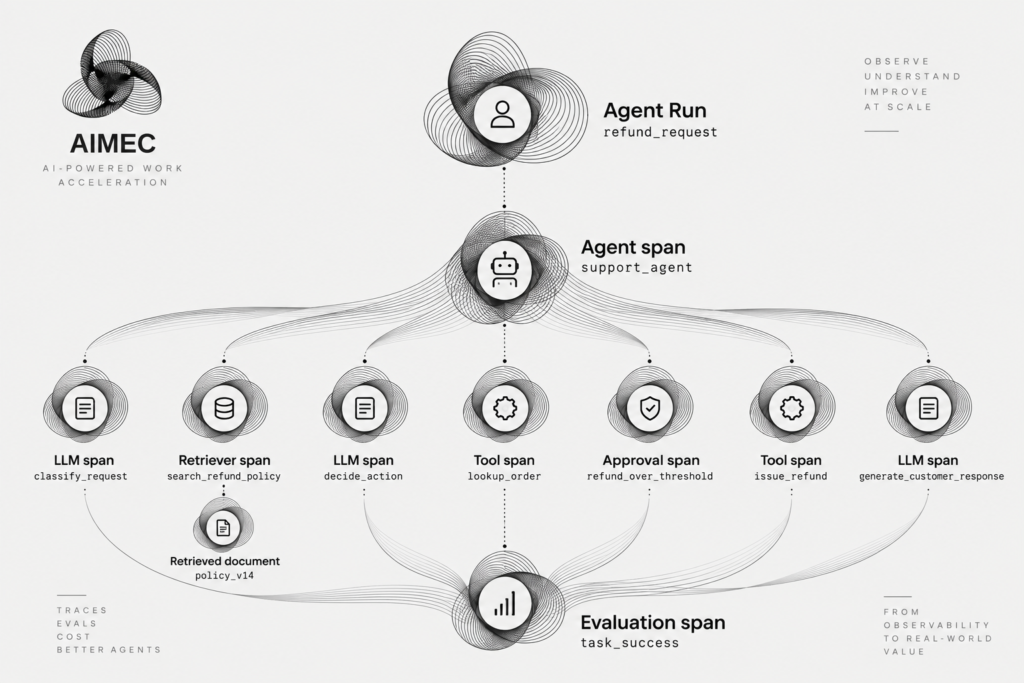
Parent-child relationships are important because they preserve causality. You can see that a particular tool call happened because of one model decision, which itself was based on specific retrieved context.
OpenInference similarly models traces as trees in which a root operation contains child LLM, agent, tool, retriever and other spans.
What You Need to Capture on Every Run
Start with a run-level envelope that can join every event belonging to the same task.
At minimum, capture:
- Run and session IDs
- Agent and workflow name
- Task type
- Agent/application version
- Model and provider
- Prompt or instruction version
- Tool calls and outcomes
- Retrieval operations and source identifiers
- State transitions
- Human approvals or escalations
- Input and output token usage
- Cost
- End-to-end latency
- Errors and retries
- Evaluation results
- Final task outcome
Do not make raw prompts and private business data universally visible simply because tracing supports them. Observability design should include masking, retention controls and access policies from the beginning. OpenInference explicitly treats privacy controls and masking as part of its observability model because prompts and completions can contain sensitive information.
Trace Model Calls
An LLM call should be its own span.
Capture the model and provider, model parameters, prompt or prompt version, token usage, duration, retry count, finish reason and estimated cost.
Where providers expose more granular usage, distinguish normal input tokens from cached input or reasoning-related usage rather than storing only one total.
This gives you much more useful questions to query later:
Which model version increased cost per successful task? Did a new prompt increase output tokens? Are retries concentrated on one provider? Is the model actually the source of your latency?
Token economics are explicitly treated as first-class telemetry in OpenInference rather than incidental metadata.
Trace Tool Calls
Tool execution is where an agent stops merely generating text and begins affecting other systems.
For every call, record the tool name, sanitized arguments, permissions used, start and end time, result status, retry count, error information and whether approval was required.
For tools that can create, update, delete, purchase, publish or communicate externally, also record the action category.
That allows you to distinguish:
tool = crm.lookup_customer
action = read
from:
tool = payments.issue_refund
action = write
approval_required = true
This is particularly important when implementing human-in-the-loop approval. Approval should be observable as part of the agent trajectory, not kept in a disconnected audit log.
Trace Retrieval and Memory
Retrieval failures frequently masquerade as model failures. A model may generate a perfectly reasonable answer based on the wrong document. A retriever span should therefore capture the query, source or index, returned document IDs, chunks, ranking information and available relevance signals.
OpenInference includes attributes for retrieved document IDs, content, metadata and document scores, allowing retrieval evidence to remain associated with the trace that consumed it.
Treat agent memory similarly. Record important memory reads, writes and updates so an investigation can distinguish a model reasoning problem from stale or incorrect context entering the model.
Trace Multi-Agent Handoffs
Multi-agent systems add another causal boundary.
When Agent A delegates to Agent B, capture:
- Parent and child agent
- Delegated task
- Context passed across the boundary
- Start and completion time
- Child result
- Child error
- Result returned to the parent
A handoff should not create an observability black hole.
Modern tracing implementations already model agent handoffs as dedicated spans, preserving the relationship between the originating agent and the receiving agent.
This becomes increasingly important as the number of agents involved in one workflow increases. See AIMEC’s comparison of LangGraph vs CrewAI for more on multi-agent orchestration patterns.
The Metrics That Belong on the Dashboard
Dashboards should aggregate agent outcomes, not just infrastructure activity.
| Metric | What it tells you |
| Task success / eval score | Whether the agent actually completes its intended work |
| Tool success rate | Whether integrations are reliable |
| Retry rate | Whether models, tools or workflows repeatedly fail |
| Steps per task | Whether the agent is becoming inefficient or looping |
| p50 latency | Typical performance |
| p95/p99 latency | Tail behavior users are more likely to notice |
| Cost per successful task | Economic efficiency of useful outcomes |
| Tokens per task | Model usage trends |
| Human escalation rate | How often automation requires intervention |
| Approval rejection rate | How often proposed actions violate expectations |
| Loop/timeout rate | Whether workflows fail to converge |
| Model/provider failure rate | External dependency reliability |
Averages alone are dangerous. If the average agent run takes four seconds but the p95 is 28 seconds, a meaningful portion of users are experiencing a very different system.
Likewise, raw token spend matters less than AI cost per completed task.
Evals Turn Telemetry Into Quality Monitoring
Tracing explains the execution. Evals determine whether that execution was good.
Offline evals are useful before deployment. You run known cases against a version of the agent and compare results before releasing a change.
Online evals operate on production behavior. They can grade samples of real traces for criteria such as correctness, groundedness, policy compliance or task completion.
Those scores should remain attached to the trace that produced them.
OpenInference supports evaluation or annotation signals from human reviewers, LLM judges and deterministic code, and allows them to apply at span, trace or session level.
This creates a powerful improvement loop:
Production trace

      ↓

Evaluation failure

      ↓

Inspect failed spans

      ↓

Identify failure mode

      ↓

Add trace to dataset

      ↓

Change prompt/tool/retrieval/workflow

      ↓

Regression evaluation

      ↓

Deploy
That connection between production telemetry and regression testing is one of the most important parts of agent engineering. For a deeper treatment of the evaluation layer, see LLM Evals Explained.
Cost Attribution
Agent costs should be attributed at several levels simultaneously.
You should be able to aggregate spend per model, agent, workflow, customer and task type.
Tool costs may also matter. A $0.03 model run that triggers a $0.20 external search API is not a $0.03 task.
The most operationally useful calculation is often:
cost per successful task
=
total cost of runs
÷
successfully completed tasks
That connects technical optimization to business economics.
OpenTelemetry and OpenInference
You do not need to invent an entirely proprietary telemetry format.
OpenTelemetry provides the underlying model for distributed traces, spans, metrics and associated semantic conventions. Its current GenAI attribute registry includes operations such as chat, execute_tool, invoke_agent, invoke_workflow and retrieval. These GenAI conventions continue to evolve, so implementation teams should version their instrumentation assumptions rather than treating every current convention as permanently fixed.
OpenInference adds a more explicit AI-oriented vocabulary on top of OpenTelemetry, including span kinds such as LLM, AGENT, TOOL, RETRIEVER, GUARDRAIL and EVALUATOR.
The practical advantage is portability. If your agent emits standardized telemetry, changing frameworks or observability backends does not require redesigning your entire instrumentation model.
Alerting Rules for Production Agents
Do not alert on every unusual trace. Alert on meaningful deviations from expected behavior.
Useful production rules include:
- Cost per task exceeds its normal range
- Tool failure rate spikes
- p95 task latency regresses materially
- Evaluation scores fall below the accepted threshold
- Steps per task indicate a possible loop
- A workflow reaches its maximum iteration count
- An unexpected write-capable tool is invoked
- An approval-required action occurs without the expected approval event
- Human escalation rate changes sharply
- A model or provider error rate rises
Thresholds should be based on each workflow’s baseline. A research agent taking 30 seconds may be healthy. A customer-facing routing agent taking 30 seconds probably is not.
Debugging an Agent Incident End to End
Imagine a customer reports that an agent incorrectly rejected a refund. The API logs show HTTP 200. No exception occurred. You locate the trace using the session ID.
The final model span shows the agent saying the purchase falls outside the refund window. The preceding retrieval span reveals something more interesting: the agent retrieved an older refund policy.
The retriever selected refund_policy_v11, while the current policy is refund_policy_v14.
The incident is therefore not initially classified as “the model hallucinated.” The evidence points to retrieval.
The engineering team can now:
- Preserve the failed trace.
- Add the customer scenario to the evaluation dataset.
- Correct the index, document filtering or retrieval logic.
- Rerun the case.
- Confirm that the correct policy is retrieved.
- Run the wider regression suite to ensure other refund scenarios still pass.
- Deploy the fix.
- Monitor production evals for the same failure signature.
Production traces can therefore become test cases rather than disappearing into an incident ticket. Current observability practice increasingly connects trace investigation, annotations, datasets and experiments in exactly this type of feedback loop.
That is a much stronger improvement mechanism than simply adjusting the prompt until the example appears to work.
Build vs Buy an Observability Stack
Building your own observability layer gives you maximum control over telemetry, retention, data location and custom business metrics.
Buying or adopting an existing platform can accelerate trace visualization, evaluation workflows, dataset creation and alerting.
The decision should focus on architecture rather than feature-count comparisons.
Evaluate:
- OpenTelemetry compatibility
- OpenInference support
- Self-hosting and privacy requirements
- Evaluation integration
- Data retention controls
- Multi-agent trace support
- Custom metrics
- Exportability
- Pricing at expected trace volume
Whichever route you choose, avoid coupling your agent architecture so tightly to one observability provider that moving your telemetry becomes an application rewrite.
Production Checklist
Before treating an agent as production-ready, verify that:
- Every run has a trace ID.
- LLM, tool, retrieval and agent operations can be reconstructed.
- Model and prompt versions are recorded.
- Tool arguments and outcomes are auditable.
- Sensitive telemetry is masked appropriately.
- Token and cost data can be attributed to tasks.
- p50, p95 and p99 latency are visible.
- Task quality is measured through evals.
- Human approvals are traceable.
- Looping and excessive retries can be detected.
- Failed production cases can enter regression datasets.
- Important behavioral changes trigger alerts.
Observability should be designed while developing the agent, not added after incidents begin.
AIMEC’s AI agent development services focus on production agent architecture, integrations, governance and the surrounding engineering required to operate these systems reliably. You can also read our AI Agent Integrations Guide or start with AI Agents Explained if you are still designing the underlying architecture.
From Agent Logs to an Engineering Feedback Loop
Production AI agent observability should answer four questions:
What happened? Why did it happen? Was the outcome good? What should we change?
Tracing answers the first two. Evals help answer the third. Connecting failed production traces back into datasets, regression tests and engineering changes answers the fourth.
That is the difference between simply logging an AI agent and operating one as a production system.
Frequently Asked Questions
What is the difference between AI monitoring and observability?
AI monitoring tracks predefined metrics and conditions across a system, such as latency, errors, token consumption and evaluation scores. AI observability provides the underlying evidence required to investigate those signals. For agents, that usually means an end-to-end trace containing model calls, tool calls, retrieval, state changes, handoffs and outcomes. Monitoring tells you something changed. Observability gives engineers the information required to investigate why.
What should an AI agent trace include?
A useful trace should identify the run, session, workflow, agent version, model calls, tool calls, retrieval operations, state transitions, approvals, errors, retries, token usage, cost and final outcome. Each significant operation should normally appear as a child span beneath the parent agent run so the causal execution path can be reconstructed.
Do AI agents need OpenTelemetry?
Not necessarily. You can build proprietary instrumentation. However, OpenTelemetry gives teams a widely adopted telemetry foundation, while AI-focused conventions such as OpenInference provide additional semantics for operations including LLM calls, tools, retrieval and agent workflows. Standardized instrumentation can also reduce dependence on a single observability backend.
How do you monitor AI agent quality?
Use evals alongside tracing. An evaluation can measure criteria such as correctness, groundedness, task completion or policy compliance. Those results should be attached to the relevant span, trace or session so engineers can investigate the execution behind a poor score. Production failures should then feed back into offline regression datasets.
How do you track AI agent cost?
Track token and provider usage at the individual model-call level and aggregate it upward to the run. Then report cost by agent, model, workflow, customer and task type. For most businesses, one of the strongest operational measures is not simply total AI spend but cost per successfully completed task. That metric shows whether increasing model usage is producing proportionately more business value.

Steven Walgenbach is an AI Engineer specializing in AI agents, large language models, retrieval-augmented generation and business process automation. He designs and builds practical AI systems that connect with existing tools, data sources and workflows to help businesses reduce manual work, improve decision-making and scale more efficiently.
His work includes developing multi-agent systems, private and locally hosted AI solutions, custom knowledge assistants, SEO automation pipelines and LLM-powered applications using Python, LangGraph, CrewAI, the OpenAI Agents SDK and other modern AI frameworks.
Through AIMEC, Steven helps businesses move beyond AI experimentation and identify practical opportunities where artificial intelligence can deliver measurable operational and commercial value.